Spider Chart
How-to Guide
Spider chart, also known as Polar(Radar) chart, is a type of chart that plots one or more groups of values over multiple common variables, making it easy to see the relative strengths and weaknesses of each group at a glance.
Quick Start
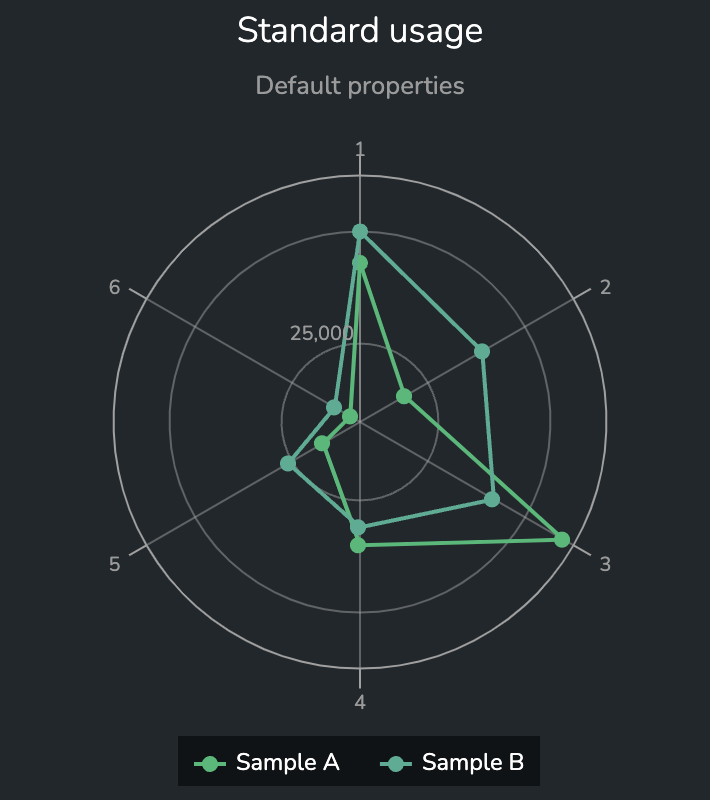
Any SDD that can be represented in a regular X-Y chart can be turned into a spider chart. The following sdd/table/array-of-objects can be showed as a simple spider chart.
{
  "sddFormat": "sdd/table/array-of-objects",
  "version": "1.0.0",
  "definitions": {
    "series": {
      "kind": "string"
    },
    "x": {
      "kind": "string"
    },
    "y": {
      "kind": "number"
    },
    "id": {
      "kind": "number",
      "optional": true
    },
    "color": {
      "kind": "string",
      "optional": true
    }
  },
  "data": [
    {
      "series": "Sample A",
      "x": 1,
      "y": 43000,
      "id": 1
    },
    {
      "series": "Sample A",
      "x": 2,
      "y": 19000,
      "id": 2
    },
    {
      "series": "Sample A",
      "x": 3,
      "y": 60000,
      "id": 3
    },
    {
      "series": "Sample A",
      "x": 4,
      "y": 35000,
      "id": 4
    },
    {
      "series": "Sample A",
      "x": 5,
      "y": 17000,
      "id": 5
    },
    {
      "series": "Sample A",
      "x": 6,
      "y": 10000,
      "id": 6
    },
    {
      "series": "Sample B",
      "x": 1,
      "y": 50000,
      "id": 7
    },
    {
      "series": "Sample B",
      "x": 2,
      "y": 39000,
      "id": 8
    },
    {
      "series": "Sample B",
      "x": 3,
      "y": 42000,
      "id": 9
    },
    {
      "series": "Sample B",
      "x": 4,
      "y": 31000,
      "id": 10
    },
    {
      "series": "Sample B",
      "x": 5,
      "y": 26000,
      "id": 11
    },
    {
      "series": "Sample B",
      "x": 6,
      "y": 14000,
      "id": 12
    }
  ]
}
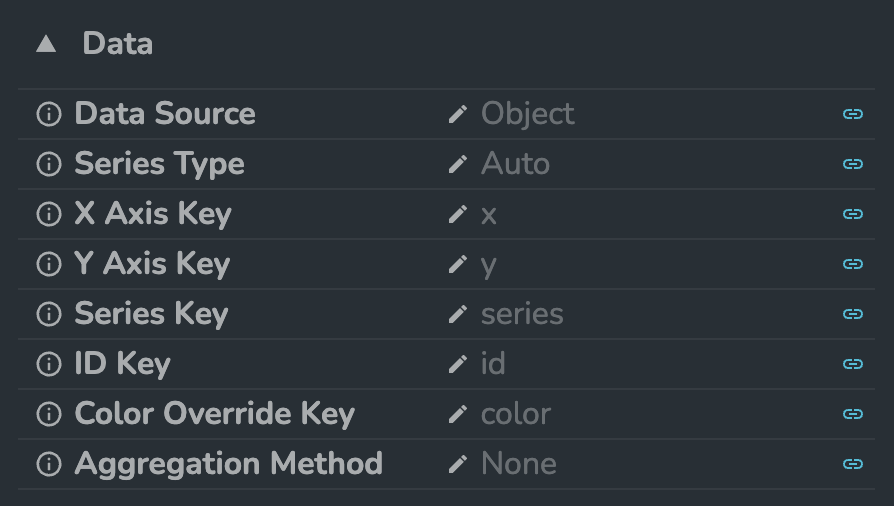
Linking the SDD to the chart requires defining the data keys. By default, the chart uses the following keys in data mapping.
{
  "seriesKey": "series",
  "xAxisKey": "x",
  "yAxisKey": "y",
  "idKey": "id",
  "colorKey": "color"
}
The seriesKey, xAxisKey and yAxisKey are required keys in the data mapping. And the idKey and colorKey are optional keys for identifying selection and customising colours. See Technical Reference Guide for details.
Here are some screenshots that shows the result of using the sample data above with the default data keys.
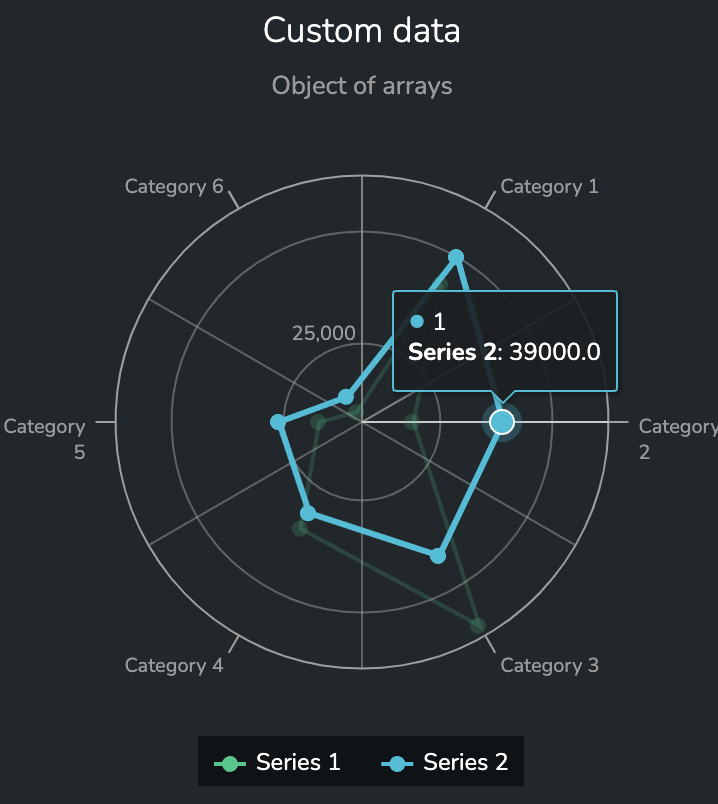
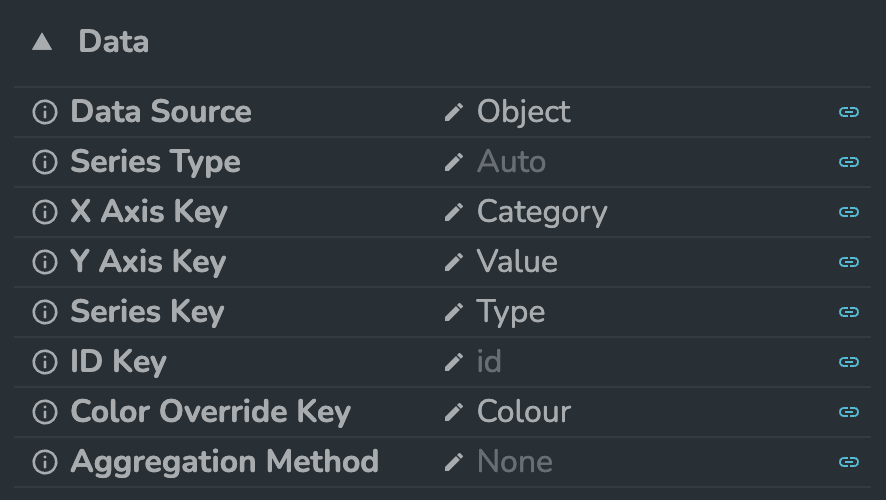
Here's another example of using sdd/table/object-of-arrays and custom data keys.
{
  "sddFormat": "sdd/table/object-of-arrays",
  "version": "1.0.0",
  "definitions": {
    "Category": {
      "kind": "string",
      "optional": true
    },
    "Type": {
      "kind": "string",
      "optional": true
    },
    "Value": {
      "kind": "number",
      "optional": true
    },
    "Colour": {
      "kind": "string",
      "optional": true
    }
  },
  "data": {
    "Category": [
      "Category 1",
      "Category 2",
      "Category 3",
      "Category 4",
      "Category 5",
      "Category 6",
      "Category 1",
      "Category 2",
      "Category 3",
      "Category 4",
      "Category 5",
      "Category 6"
    ],
    "Type": [
      "Series 1",
      "Series 1",
      "Series 1",
      "Series 1",
      "Series 1",
      "Series 1",
      "Series 2",
      "Series 2",
      "Series 2",
      "Series 2",
      "Series 2",
      "Series 2"
    ],
    "Value": [
      43000, 19000, 60000, 35000, 17000, 10000, 50000, 39000, 42000, 31000,
      26000, 14000
    ],
    "Colour": [
      "#00C788",
      "#00C788",
      "#00C788",
      "#00C788",
      "#00C788",
      "#00C788",
      "#00BFD9",
      "#00BFD9",
      "#00BFD9",
      "#00BFD9",
      "#00BFD9",
      "#00BFD9"
    ]
  }
}
Display Options
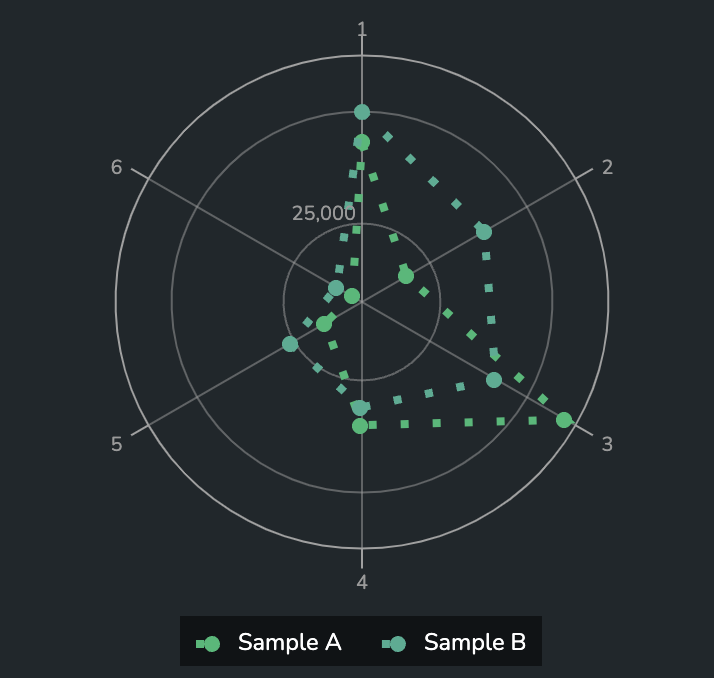
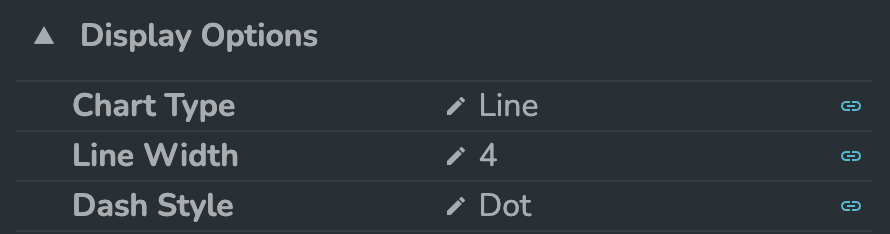
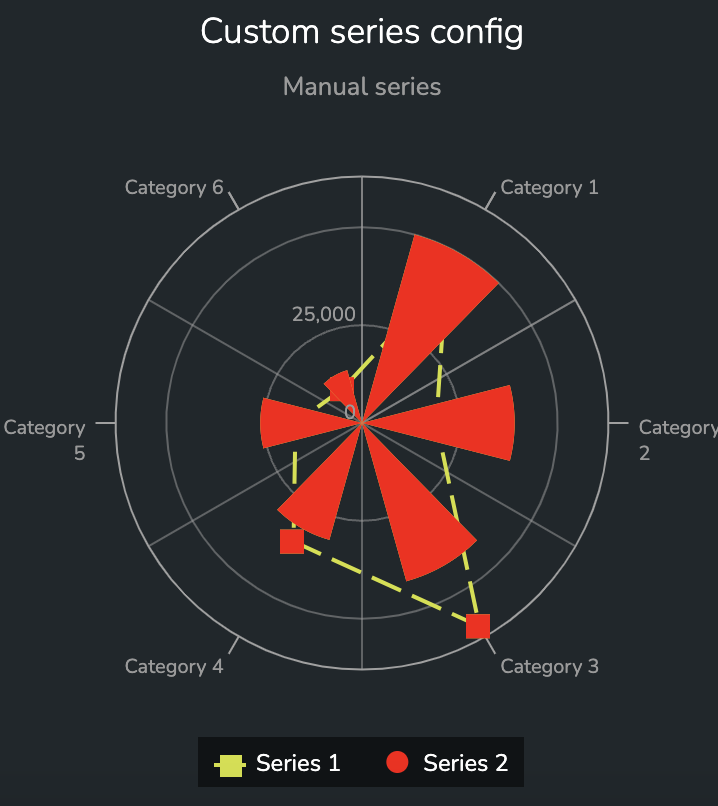
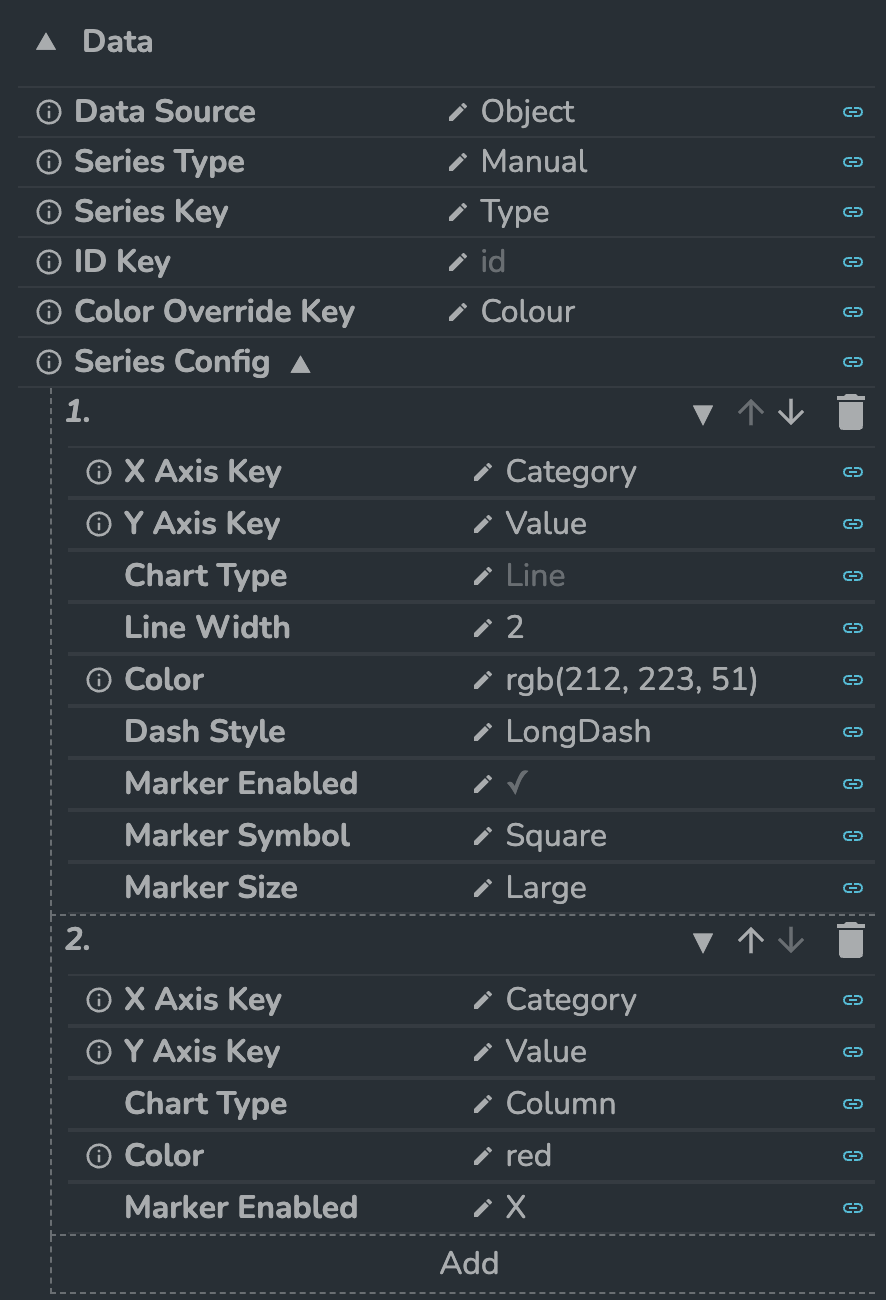
The current spider chart supports two chart types, Line and Column. If the Chart Type is Line, additional options Line Width and Dash Style are available for configuring. These display options can be configured globally for all the series in the Display Options panel, or they can be provided as part of the Series Config in the Data panel. The latter requires Series Type to be set as Manual and allows configuring different display options based on series.
Here are some screenshots that demonstrates the two approaches above.
Custom Display Options
Custom Series Configurations
The other display options available are the common ones from any X-Y chart.
Pane
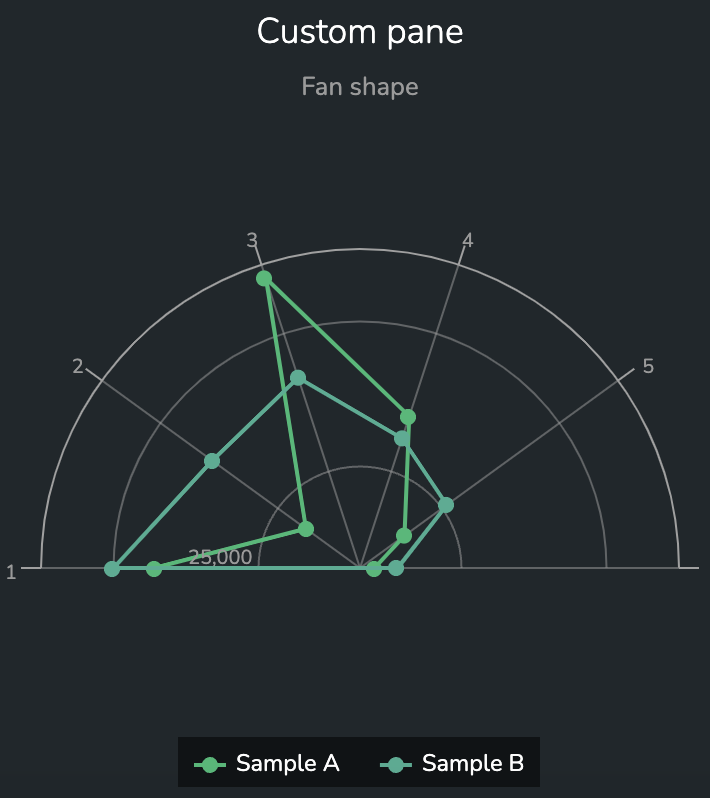
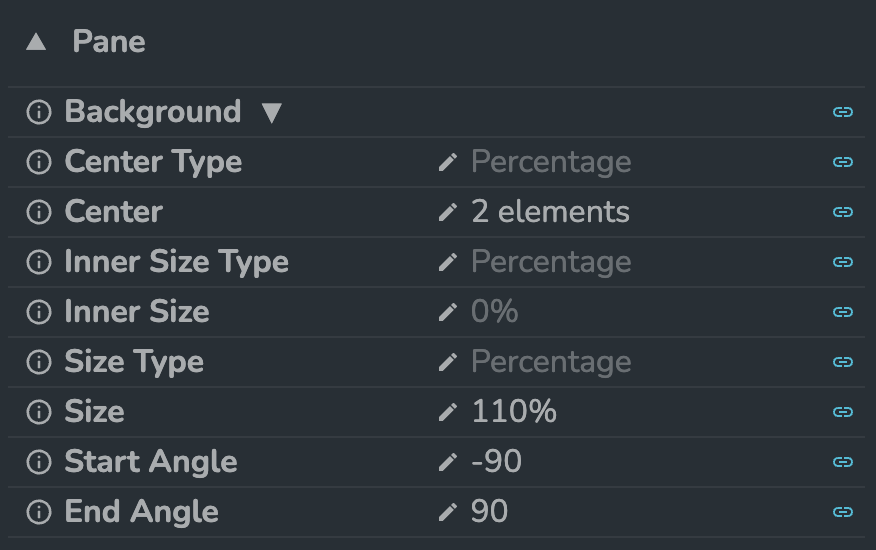
Pane is another set of options that controls the way of displaying. The pane options can be used to adjust the background, center, startAngle and endAngle of the chart.
Here's an example of a spider chart with a custom pane.
Miscellaneous
The spider chart provides other options to configure various aspects, including Animation, X Axis, Y Axis, Caption, Data Labels, Legend, Selection, Titles, Tooltips, etc. As mentioned above, the spider chart is another representation of a regular X-Y chart. The ways of using the above options are the same as any X-Y chart. Technically, they share the same implementation in code. Therefore, you can reference Line Chart for details on how to use those options.
There are more resources available for the Spider Chart component, including:
- Technical Reference Guide - See the Technical Reference Guide for more